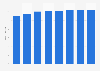
Nota: La página que ha solicitado no está en su idioma predeterminado. Usted está usando nuestra plataforma en otro idioma ahora.
Media usage in the U.S. - statistics & facts
Key insights
- Daily time spent with media worldwide
- 473 mins
Detailed statistics
Time spent with media worldwide 2011-2021
- Time spent per day with digital media in the U.S.
- 454 mins
Detailed statistics
Time spent with digital vs. traditional media in the U.S. 2011-2025
- Time spent with TV in the U.S.
- 197 mins
Detailed statistics
Daily media consumption in the U.S. 2021, by format
Editor’s Picks Current statistics on this topic
Current statistics on this topic
Related topics
Recommended statistics
Overview
5
- Premium Statistic Time spent with media in the U.S. 2011-2022
- Premium Statistic Daily media consumption in the U.S. 2021, by format
- Premium Statistic Time spent with digital vs. traditional media in the U.S. 2011-2025
- Premium Statistic Digital media users in the United States 2017-2027, by segment
- Premium Statistic Money spent on media per month in the U.S. 2022, per user type
Overview
-
Premium Statistic
Time spent with media in the U.S. 2011-2022
Time spent per day with major media in the United States from 2011 to 2022 (in minutes)
-
Premium Statistic
Daily media consumption in the U.S. 2021, by format
Average time spent with major media per day in the United States as of April 2021, by format (in minutes)
-
Premium Statistic
Time spent with digital vs. traditional media in the U.S. 2011-2025
Time spent per day with digital versus traditional media in the United States from 2011 to 2025 (in minutes)
-
Premium Statistic
Digital media users in the United States 2017-2027, by segment
Number of digital media users in the United States from 2017 to 2027, by segment (in millions)
-
Premium Statistic
Money spent on media per month in the U.S. 2022, per user type
Monthly budget allocated to media and technology in the United States as of November 2022, by user type (in U.S. dollars)
TV
6
- Premium Statistic Number of TV households in the U.S. 2000-2024
- Premium Statistic TV households in the largest local TV markets in the U.S. 2020-2021
- Premium Statistic Share of cord-cutters/nevers in the U.S. 2014-2025
- Premium Statistic U.S. TV consumption: daily viewing time 2009-2022, by age group
- Premium Statistic U.S. TV consumption: average viewing time 2009-2022, by ethnicity
- Premium Statistic U.S. TV consumption: average viewing time 2009-2022, by gender
TV
-
Premium Statistic
Number of TV households in the U.S. 2000-2024
Number of TV households in the United States from season 2000-2001 to season 2023-2024 (in millions)
-
Premium Statistic
TV households in the largest local TV markets in the U.S. 2020-2021
Number of TV households in the largest local TV markets in the United States in the broadcast season 2020-2021
-
Premium Statistic
Share of cord-cutters/nevers in the U.S. 2014-2025
Share of TV households without a traditional TV subscription in the United States from 2014 to 2025
-
Premium Statistic
U.S. TV consumption: daily viewing time 2009-2022, by age group
Average daily time spent watching TV per capita in the United States from 2009 to 2022, by age group (in hours)
-
Premium Statistic
U.S. TV consumption: average viewing time 2009-2022, by ethnicity
Average daily time spent watching TV per capita in the United States from 2009 to 2022, by ethnicity (in hours)
-
Premium Statistic
U.S. TV consumption: average viewing time 2009-2022, by gender
Average daily time spent watching TV per capita in the United States from 2009 to 2022, by gender (in hours)
VoD
6
- Premium Statistic Users of video-on-demand in the U.S. 2017-2027, by type
- Premium Statistic Daily time spent with video by U.S. adults 2019-2027, by device
- Premium Statistic Consumer spending on SVOD in the U.S. 2018-2022
- Premium Statistic Reasons for not paying for video streaming subscriptions in the U.S. 2022
- Premium Statistic Expected change in video streaming use in the future in the U.S. 2022
- Premium Statistic Penetration rates of selected subscription video-on-demand services in the U.S. 2022
VoD
-
Premium Statistic
Users of video-on-demand in the U.S. 2017-2027, by type
Number of video-on-demand users in the United States from 2017 to 2027, by type (in millions)
-
Premium Statistic
Daily time spent with video by U.S. adults 2019-2027, by device
Average daily time spent with video content among adults in the United States from 2019 to 2027, by device (in minutes)
-
Premium Statistic
Consumer spending on SVOD in the U.S. 2018-2022
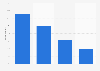
Consumer spending on subscription video-on-demand (SVOD) in the United States from 2nd quarter 2018 to 3rd quarter 2022 (in billion U.S. dollars)
-
Premium Statistic
Reasons for not paying for video streaming subscriptions in the U.S. 2022
Major reasons why adults do not pay for video streaming subscriptions in the United States as of August 2022
-
Premium Statistic
Expected change in video streaming use in the future in the U.S. 2022
Expected change in video streaming usage over the next 12 months in the United States as of March 2022
-
Premium Statistic
Penetration rates of selected subscription video-on-demand services in the U.S. 2022
Share of households subscribing to selected video streaming platforms in the United States as of September 2022
Magazines and newspapers
6
- Premium Statistic Leading online news brands in the U.S. 2023
- Premium Statistic Magazines with largest monthly audience in the U.S. 2022
- Premium Statistic Daily newspaper consumption by brand in the U.S. 2023
- Premium Statistic Magazine / weekly newspaper consumption by brand in the U.S. 2023
- Premium Statistic Most purchased daily newspapers by type in the U.S. 2023
- Premium Statistic Magazine / weekly newspaper purchases by type in the U.S. 2023
Magazines and newspapers
-
Premium Statistic
Leading online news brands in the U.S. 2023
Share of consumers who have used selected global online news brands and sites to access news in the last week in the United States as of February 2023
-
Premium Statistic
Magazines with largest monthly audience in the U.S. 2022
Leading magazines in the United States in 4th quarter 2022, by total average monthly audience (in millions)
-
Premium Statistic
Daily newspaper consumption by brand in the U.S. 2023
Daily newspaper consumption by brand in the U.S. as of December 2023
-
Premium Statistic
Magazine / weekly newspaper consumption by brand in the U.S. 2023
Magazine / weekly newspaper consumption by brand in the U.S. as of December 2023
-
Premium Statistic
Most purchased daily newspapers by type in the U.S. 2023
Most purchased daily newspapers by type in the U.S. as of December 2023
-
Premium Statistic
Magazine / weekly newspaper purchases by type in the U.S. 2023
Magazine / weekly newspaper purchases by type in the U.S. as of December 2023
Books
6
- Premium Statistic U.S. daily time spent reading 2014-2022
- Basic Statistic Recreational books: consumer expenditure in the U.S. 1999-2022
- Premium Statistic Book consumption in the U.S. 2011-2021, by format
- Basic Statistic Book readers in the U.S. 2019-2021, by age group
- Premium Statistic Number of books read yearly by U.S. consumers 2021, by gender
- Premium Statistic Audiobook listeners in the U.S. 2021, by age group
Books
-
Premium Statistic
U.S. daily time spent reading 2014-2022
Average daily time spent reading per capita in the United States from 2014 to 2022 (in hours)
-
Basic Statistic
Recreational books: consumer expenditure in the U.S. 1999-2022
Consumer expenditure on recreational books in the United States from1999 to 2022 (in billion U.S. dollars)
-
Premium Statistic
Book consumption in the U.S. 2011-2021, by format
Share of adults who have read a book in any format in the last 12 months in the United States from 2011 to 2021, by format
-
Basic Statistic
Book readers in the U.S. 2019-2021, by age group
Share of adults who have read a book in any format in the last 12 months in the United States in 2019 and 2021, by age group
-
Premium Statistic
Number of books read yearly by U.S. consumers 2021, by gender
Number of books read each year by consumers in the past year in the United States as of December 2021, by gender
-
Premium Statistic
Audiobook listeners in the U.S. 2021, by age group
Share of adults who have listened to an audiobook in the last 12 months in the United States as of February 2021, by age group
Radio
5
- Premium Statistic Radio reach in the U.S. in 2023, by age and gender
- Premium Statistic Radio reach in the U.S. in 2023, by time of day, gender, and age
- Premium Statistic Share of weekly online radio listeners in the U.S. 2000-2023
- Premium Statistic Share of monthly online radio listeners in the U.S. 2007-2023
- Premium Statistic Online radio reach in the U.S. 2021, by age group
Radio
-
Premium Statistic
Radio reach in the U.S. in 2023, by age and gender
Weekly radio reach in the United States as of June 2023, by age and gender
-
Premium Statistic
Radio reach in the U.S. in 2023, by time of day, gender, and age
Weekly radio reach in the United States as of June 2023, by time of day, gender, and age group
-
Premium Statistic
Share of weekly online radio listeners in the U.S. 2000-2023
Share of weekly online radio listeners in the United States from 2000 to 2023
-
Premium Statistic
Share of monthly online radio listeners in the U.S. 2007-2023
Share of monthly online radio listeners in the United States from 2007 to 2023
-
Premium Statistic
Online radio reach in the U.S. 2021, by age group
Monthly online radio reach in the United States in 2021, by age group
Music and podcasts
8
- Premium Statistic Music consumption in the U.S. in 2021, by genre & format
- Premium Statistic Weekly time spent listening to audio from selected sources in the U.S. 2023
- Premium Statistic Popular online music brands in the U.S. 2023
- Premium Statistic Music streaming penetration in the U.S. 2022, by generation
- Premium Statistic Streamed music consumption in the U.S. 2021, by genre
- Premium Statistic Share of people who listen to podcasts monthly in the U.S. 2020-2022, by age group
- Premium Statistic Reasons for not listening to podcasts in the U.S. and Europe 2021
- Premium Statistic Preferred podcast providers in the United States 2022
Music and podcasts
-
Premium Statistic
Music consumption in the U.S. in 2021, by genre & format
Distribution of music consumption in the United States in 2021, by genre and format
-
Premium Statistic
Weekly time spent listening to audio from selected sources in the U.S. 2023
Distribution of weekly time spent listening to audio content via selected sources in the United States in 2010, 2019, 2021. and 2023
-
Premium Statistic
Popular online music brands in the U.S. 2023
Online music services used most frequently in the United States as of January 2023
-
Premium Statistic
Music streaming penetration in the U.S. 2022, by generation
Share of adults who said they streamed music at least once in the past month in the United States in 2022, by generation
-
Premium Statistic
Streamed music consumption in the U.S. 2021, by genre
Distribution of streamed music consumption in the United States in 2021, by genre
-
Premium Statistic
Share of people who listen to podcasts monthly in the U.S. 2020-2022, by age group
Share of people who listen to podcasts on a monthly basis in the United States from 2020 to 2022, by age group
-
Premium Statistic
Reasons for not listening to podcasts in the U.S. and Europe 2021
Reasons why people do not consume podcasts in the Unites States and Europe in 2021
-
Premium Statistic
Preferred podcast providers in the United States 2022
Preferred podcast providers among adults in the United States as of October 2022
Internet & social media
8
- Basic Statistic Internet users in the United States 2020-2029
- Basic Statistic Social media users in the United States 2020-2029
- Basic Statistic U.S. internet usage penetration 2023, by age group
- Premium Statistic Weekly time spent on leading online activities in the U.S. 2022
- Premium Statistic U.S. Facebook users 2024, by age and gender
- Premium Statistic U.S. Instagram users 2024, by age group
- Basic Statistic Twitter: usage reach in the United States 2023, by age group
- Premium Statistic TikTok audiences in the U.S. 2021, by age and gender
Internet & social media
-
Basic Statistic
Internet users in the United States 2020-2029
Number of internet users in the United States from 2020 to 2029 (in millions)
-
Basic Statistic
Social media users in the United States 2020-2029
Number of social media users in the United States from 2020 to 2029 (in millions)
-
Basic Statistic
U.S. internet usage penetration 2023, by age group
Share of adults in the United States who use the internet as of September 2023, by age group
-
Premium Statistic
Weekly time spent on leading online activities in the U.S. 2022
Most popular weekly online activities for internet users in the United States as of January 2022, by time spent (in hours)
-
Premium Statistic
U.S. Facebook users 2024, by age and gender
Share of Facebook users in the United States as of January 2024, by age group and gender
-
Premium Statistic
U.S. Instagram users 2024, by age group
Distribution of Instagram users in the United States as of January 2024, by age group
-
Basic Statistic
Twitter: usage reach in the United States 2023, by age group
Percentage of U.S. adults who use Twitter as of September 2023, by age group
-
Premium Statistic
TikTok audiences in the U.S. 2021, by age and gender
Distribution of TikTok audiences in the United States in 2021, by age and gender
Gaming
7
- Premium Statistic Number of video gamers in the U.S. 2019-2029
- Basic Statistic U.S. video gaming audiences 2006-2023, by gender
- Basic Statistic U.S. video gaming audiences 2022, by age group
- Basic Statistic Distribution of video gamers U.S. 2023, by engagement
- Premium Statistic Consumer spending on video game content in the U.S. 2010-2023
- Premium Statistic Weekly gaming hours of adults in the U.S. 2023
- Premium Statistic Preferred video game devices in the U.S. 2023
Gaming
-
Premium Statistic
Number of video gamers in the U.S. 2019-2029
Number of video game users in the United States from 2019 to 2029 (in millions)
-
Basic Statistic
U.S. video gaming audiences 2006-2023, by gender
Distribution of video gamers in the United States from 2006 to 2023, by gender
-
Basic Statistic
U.S. video gaming audiences 2022, by age group
Distribution of video gamers in the United States in 2022, by age group
-
Basic Statistic
Distribution of video gamers U.S. 2023, by engagement
Distribution of video gamers in the United States in 2023, by engagement level
-
Premium Statistic
Consumer spending on video game content in the U.S. 2010-2023
Consumer spending on video game content in the United States from 2010 to 2023 (in billion U.S. dollars)
-
Premium Statistic
Weekly gaming hours of adults in the U.S. 2023
Weekly time spent playing video games according to adults in the United States as of December 2023 (in hours)
-
Premium Statistic
Preferred video game devices in the U.S. 2023
Leading video game devices according to gamers in the United States in 2023
Further reportsGet the best reports to understand your industry
Get the best reports to understand your industry
Contact
Get in touch with us. We are happy to help.
Meredith Alda
Sales Manager– Contact (United States)
Mon - Fri, 9am - 6pm (EST)
Yolanda Mega
Operations Manager– Contact (Asia)
Mon - Fri, 9am - 5pm (SGT)
Kisara Mizuno
Senior Business Development Manager– Contact (Asia)
Mon - Fri, 10:00am - 6:00pm (JST)
Lodovica Biagi
Director of Operations– Contact (Europe)
Mon - Fri, 9:30am - 5pm (GMT)
Carolina Dulin
Group Director - LATAM– Contact (Latin America)
Mon - Fri, 9am - 6pm (EST)