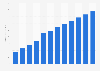
Nota: La página que ha solicitado no está en su idioma predeterminado. Usted está usando nuestra plataforma en otro idioma ahora.
Programmatic digital display ad spend in the U.S. was estimated at 145 billion U.S. dollars that year.
In the third quarter of 2023, 73 percent of digital advertising expenditure in the United States was spent programmatically and the remaining 27 percent directly. Distribution of digital advertising spending in the United States in 3rd quarter 2023, by purchase method
Basic Account
Get to know the platform
You only have access to basic statistics.
This statistic is not included in your account.
Starter Account
The ideal entry-level account for individual users
- Instant access to 1m statistics
- Download in XLS, PDF & PNG format
- Detailed references
$199 USD / Month *
Professional Account
Full access
Business Solutions including all features.
* Prices do not include sales tax.
Other statistics that may interest you Statistics on
About the industry
10
- Basic Statistic Leading communication service providers as to HORIZONT creative ranking Germany 2019
- Premium Statistic Digital advertising expenditure in Russia 2022, by segment
- Premium Statistic Advertising expenditure in Ukraine 2011-2022
- Premium Statistic Largest internet display advertisers in the U.S. 2022
- Premium Statistic Digital display advertising expenditure in Finland 2008-2015
- Premium Statistic Change in advertising spending in the U.S. 2023, by medium
- Premium Statistic Leading advertising categories in Brazil 2022, by advertising spending
- Premium Statistic Internet advertising expenditure share in Poland 2011-2023
- Premium Statistic Display advertising revenue in the United Kingdom (UK) Q1 2009-Q4 2019
- Premium Statistic Danish internet advertising revenue 2009-2019, by target
About the region
10
- Basic Statistic Estimated expenses of out-of-home (OOH) advertising companies in the U.S. 2007-2022
- Premium Statistic Largest magazine advertisers in the U.S. 2022
- Basic Statistic Number of employees in the advertising industry in the U.S. 2009-2021, by segment
- Premium Statistic Super Bowl advertising revenue 2003-2023
- Premium Statistic Revenue sources of U.S. direct mail advertising companies 2021
- Basic Statistic Estimated revenue of out-of-home (OOH) advertising companies in the U.S. 2000-2022
- Premium Statistic Expenses of U.S. direct mail advertising companies 2007-2021
- Premium Statistic Revenue of U.S. direct mail advertising companies 2000-2021
- Premium Statistic Media buying revenue of U.S. advertising agencies 2010-2021
- Premium Statistic Integrated services revenue of U.S. advertising agencies 2010-2021
Selected statistics
1
Other regions
10
- Premium Statistic Highest spending radio advertising planning agencies in the UK 2021
- Premium Statistic Job openings in advertising agencies in Germany 2021, by job area
- Premium Statistic Number of advertising spaces in newspapers in Italy 2017-2020
- Premium Statistic Share of marketing companies planning budget cuts due to COVID-19 in the Nordics 2020
- Premium Statistic Broadcast time of television advertising Spain 2019 by type
- Premium Statistic Advertising spending change in Sweden 2018-2022
- Premium Statistic Brazil: leading advertising categories 2018
- Premium Statistic Share of ad revenue in Qatar by media platform 2015
- Premium Statistic Newspaper advertising expenditure share in Indonesia 2018-2020
- Premium Statistic Total cinema advertising investments in Flanders (Belgium) 2012-2018
Related statistics
10
- Premium Statistic Radio advertising product sectors ranked by spending in the UK 2022
- Premium Statistic Commercial radio share of advertising revenue in the United Kingdom (UK) 2009-2022
- Premium Statistic Ranking of advertising companies in Norway 2023, by revenue
- Premium Statistic Ranking of advertising companies in Sweden 2023, by revenue
- Premium Statistic Ranking of advertising companies in the Nordic countries 2023, by profit
- Premium Statistic Ranking of advertising companies in Denmark 2023, by revenue
- Premium Statistic Revenue of advertising agencies in Norway 2021, by service
- Premium Statistic Employees in advertising and marketing agencies in Sweden quarterly 2018-2020
- Premium Statistic Impact level of the coronavirus pandemic on advertisers in Sweden 2020
- Premium Statistic Expected effects on advertisers due to the coronavirus pandemic in Sweden 2020
Further related statistics
10
- Pfizer's ad spending 2006-2023
- Verizon: ad spend in the U.S. 2009-2022
- JPMorgan Chase: ad spend in the U.S. 2009-2022
- Global advertising expenditure of Colgate-Palmolive 2009-2023
- FIFA: revenue from marketing rights 2003-2022
- Consumer expenditure on video and audio equipment in the U.S. 1999-2019
- Online advertising of companies in China 2016
- Membership in the American Guild of Musical Artists in the U.S. 2000-2013
- Number of independent artists, writers and performers in the U.S. 2000-2013
- Consumer expenditure on live entertainment in the U.S. 1999-2013
Further Content: You might find this interesting as well
Statistics
- Pfizer's ad spending 2006-2023
- Verizon: ad spend in the U.S. 2009-2022
- JPMorgan Chase: ad spend in the U.S. 2009-2022
- Global advertising expenditure of Colgate-Palmolive 2009-2023
- FIFA: revenue from marketing rights 2003-2022
- Consumer expenditure on video and audio equipment in the U.S. 1999-2019
- Online advertising of companies in China 2016
- Membership in the American Guild of Musical Artists in the U.S. 2000-2013
- Number of independent artists, writers and performers in the U.S. 2000-2013
- Consumer expenditure on live entertainment in the U.S. 1999-2013
MediaRadar. (October 27, 2023). Distribution of digital advertising spending in the United States in 3rd quarter 2023, by purchase method [Graph]. In Statista. Retrieved April 28, 2024, from https://www.statista.com/statistics/185797/digital-display-ad-spend-usa-purchase-method/
MediaRadar. "Distribution of digital advertising spending in the United States in 3rd quarter 2023, by purchase method." Chart. October 27, 2023. Statista. Accessed April 28, 2024. https://www.statista.com/statistics/185797/digital-display-ad-spend-usa-purchase-method/
MediaRadar. (2023). Distribution of digital advertising spending in the United States in 3rd quarter 2023, by purchase method. Statista. Statista Inc.. Accessed: April 28, 2024. https://www.statista.com/statistics/185797/digital-display-ad-spend-usa-purchase-method/
MediaRadar. "Distribution of Digital Advertising Spending in The United States in 3rd Quarter 2023, by Purchase Method." Statista, Statista Inc., 27 Oct 2023, https://www.statista.com/statistics/185797/digital-display-ad-spend-usa-purchase-method/
MediaRadar, Distribution of digital advertising spending in the United States in 3rd quarter 2023, by purchase method Statista, https://www.statista.com/statistics/185797/digital-display-ad-spend-usa-purchase-method/ (last visited April 28, 2024)
Distribution of digital advertising spending in the United States in 3rd quarter 2023, by purchase method [Graph], MediaRadar, October 27, 2023. [Online]. Available: https://www.statista.com/statistics/185797/digital-display-ad-spend-usa-purchase-method/