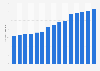
Nota: La página que ha solicitado no está en su idioma predeterminado. Usted está usando nuestra plataforma en otro idioma ahora.
In the quarter ending September 2021, the gross operating profit of businesses in the arts and recreation services industry in Australia amounted to 1.44 billion Australian dollars. This value has decreased since 2020.
Gross operating profit of the arts and recreation services industry in Australia from Q3 2017 to Q3 2021 (in billion Australian dollars)
Loading statistic...
Basic Account
Get to know the platform
You only have access to basic statistics.
Starter Account
The ideal entry-level account for individual users
- Instant access to 1m statistics
- Download in XLS, PDF & PNG format
- Detailed references
$199 USD / Month *
Professional Account
Full access
Business Solutions including all features.
* Prices do not include sales tax.
Other statistics that may interest you Statistics on
About the industry
10
- Premium Statistic Degree of free time satisfaction in Italy 2022, by age group
- Premium Statistic Degree of free time satisfaction in Italy 2009-2022
- Premium Statistic Headcount in the Brazilian arts, culture, sports, and recreation sector 2010-2021
- Premium Statistic Ferris wheels: largest worldwide 2019
- Premium Statistic Leading aquariums in the U.S., by largest tank size 2018
- Premium Statistic Leading zoos in the U.S., by size 2018
- Premium Statistic Leading aquariums globally, by largest tank size 2018
- Basic Statistic Number of artistic creation enterprises in the UK 2008-2021
- Basic Statistic Number of creative, arts and entertainment activities enterprises in the UK 2008-2021
- Premium Statistic Arts and recreation business revenue in Ukraine 2010-2021
About the region
10
- Basic Statistic Gross operating profit of the professional industry Australia 2017-2022
- Basic Statistic Persons employed by the sports and recreation industry in Australia FY 2012-2021
- Basic Statistic Total industry value added from sports and recreation in Australia FY 2010-2021
- Basic Statistic Sports and recreation industry financial figures in Australia FY 2021
- Basic Statistic Gross operating profit of the administrative industry Australia 2017-2022
- Basic Statistic Gross operating profit of the rental and hiring industry Australia 2017-2020
- Basic Statistic Number of clothing and footwear wholesaling businesses Australia FY 2023, by state
- Basic Statistic Number of liquor and tobacco wholesaling companies Australia FY 2023, by state
- Basic Statistic Number of operating dairy produce wholesaling businesses Australia FY 2023, by state
- Basic Statistic Number of operating furniture retailing businesses Australia FY 2023, by state
Other regions
10
- Basic Statistic Mobility trend in retail & recreation during the COVID-19 pandemic in Italy 2020-2022
- Premium Statistic Opinion on self-control in leisure participation amid COVID-19 Japan 2020, by type
- Premium Statistic U.S. distribution of emergency department visits, ages 20-24, 2010-2016, by activity
- Premium Statistic Private non-financial corporations gross operating surplus in the UK 2013-2019
- Premium Statistic Number of tennis terrains in Flanders (Belgium) 1984-2018, by type
- Premium Statistic Leading waterparks worldwide, by size 2019
- Premium Statistic Sports clubs and clubs for persons with special needs in Saudi Arabia 2011-2019
- Premium Statistic Estimated CI in tourism industry Thailand Q1 2023, by type of business
- Premium Statistic Number of new businesses for information and communication Vietnam 2016-2022
- Premium Statistic Annual R&D spending of business enterprises in Taiwan 2011-2021
Related statistics
10
- Basic Statistic Number of exits of businesses Australia FY 2014-2023
- Basic Statistic Number of new entries of businesses Australia FY 2023, by industry
- Basic Statistic Number of entries of businesses Australia FY 2014-2023
- Basic Statistic Change in the number of businesses Australia FY 2021, by industry
- Basic Statistic Number of retail trade companies in Australia FY 2014 - FY 2020
- Basic Statistic Number of motor cycle retailing companies in Australia FY 2020, by state
- Basic Statistic Number of motor vehicle parts retailing companies in Australia FY 2020, by state
- Basic Statistic Number of operating tire retailing businesses Australia FY 2023, by state
- Basic Statistic Business entry rate Australia FY 2020, by industry
- Basic Statistic Number of operating fuel retailing companies Australia FY 2023, by state
Further related statistics
10
- Cities with the most park playgrounds per 10,000 residents in the U.S. 2022
- Cities with the most recreation and senior centers per 20,000 residents U.S. 2022
- Net earnings of the Puma Group worldwide from 1993 to 2023
- Banco Santander global operations: geographic diversification of profit 2023
- Gross gambling yield of the gambling industry in Great Britain 2015-2022, by sector
- Walgreens operating income in the U.S. 2005-2023
- Outdoor participation in the U.S. 2021, by household income
- Snowboarding participation in the U.S. 2010-2023
- U.S. share of entrepreneurs by age 2022
- Distribution of Ahold Delhaize Group's global net sales by region 2016-2022
Further Content: You might find this interesting as well
Statistics
- Cities with the most park playgrounds per 10,000 residents in the U.S. 2022
- Cities with the most recreation and senior centers per 20,000 residents U.S. 2022
- Net earnings of the Puma Group worldwide from 1993 to 2023
- Banco Santander global operations: geographic diversification of profit 2023
- Gross gambling yield of the gambling industry in Great Britain 2015-2022, by sector
- Walgreens operating income in the U.S. 2005-2023
- Outdoor participation in the U.S. 2021, by household income
- Snowboarding participation in the U.S. 2010-2023
- U.S. share of entrepreneurs by age 2022
- Distribution of Ahold Delhaize Group's global net sales by region 2016-2022
Australian Bureau of Statistics. (November 29, 2021). Gross operating profit of the arts and recreation services industry in Australia from Q3 2017 to Q3 2021 (in billion Australian dollars) [Graph]. In Statista. Retrieved May 13, 2024, from https://www.statista.com/statistics/1078896/australia-gross-operating-profit-arts-and-recreation-services-industry/
Australian Bureau of Statistics. "Gross operating profit of the arts and recreation services industry in Australia from Q3 2017 to Q3 2021 (in billion Australian dollars)." Chart. November 29, 2021. Statista. Accessed May 13, 2024. https://www.statista.com/statistics/1078896/australia-gross-operating-profit-arts-and-recreation-services-industry/
Australian Bureau of Statistics. (2021). Gross operating profit of the arts and recreation services industry in Australia from Q3 2017 to Q3 2021 (in billion Australian dollars). Statista. Statista Inc.. Accessed: May 13, 2024. https://www.statista.com/statistics/1078896/australia-gross-operating-profit-arts-and-recreation-services-industry/
Australian Bureau of Statistics. "Gross Operating Profit of The Arts and Recreation Services Industry in Australia from Q3 2017 to Q3 2021 (in Billion Australian Dollars)." Statista, Statista Inc., 29 Nov 2021, https://www.statista.com/statistics/1078896/australia-gross-operating-profit-arts-and-recreation-services-industry/
Australian Bureau of Statistics, Gross operating profit of the arts and recreation services industry in Australia from Q3 2017 to Q3 2021 (in billion Australian dollars) Statista, https://www.statista.com/statistics/1078896/australia-gross-operating-profit-arts-and-recreation-services-industry/ (last visited May 13, 2024)
Gross operating profit of the arts and recreation services industry in Australia from Q3 2017 to Q3 2021 (in billion Australian dollars) [Graph], Australian Bureau of Statistics, November 29, 2021. [Online]. Available: https://www.statista.com/statistics/1078896/australia-gross-operating-profit-arts-and-recreation-services-industry/