Nota: La página que ha solicitado no está en su idioma predeterminado. Usted está usando nuestra plataforma en otro idioma ahora.
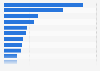
The statistic presents the share of consumers who use audio streaming services in the United States in the first quarter of 2018, broken down by ethnicity. The findings show that 45 percent of Hispanic Americans used audio streaming services in the measured period, compared to 52 percent of African Americans.
Share of consumers who use audio streaming services in the United States in 1st quarter of 2018, by ethnicity
Basic Account
Get to know the platform
You only have access to basic statistics.
This statistic is not included in your account.
Starter Account
The ideal entry-level account for individual users
- Instant access to 1m statistics
- Download in XLS, PDF & PNG format
- Detailed references
$199 USD / Month *
Professional Account
Full access
Business Solutions including all features.
* Prices do not include sales tax.
Other statistics that may interest you Hispanic media in the U.S.
Consumption
8
- Premium Statistic TV households with selected devices in the U.S. 2020, by ethnicity
- Premium Statistic Device ownership among children in the U.S. 2018, by ethnicity
- Premium Statistic Weekly time spent with media per user in the U.S. 2020, by ethnicity
- Premium Statistic Time spent with screen media among U.S. children 2017, by ethnicity
- Premium Statistic Average screen time per day permitted by parents among children in the U.S. 2018
- Premium Statistic Audio streaming service usage U.S. Q1 2018, by ethnicity
- Premium Statistic Video content providers used by Hispanics in the United States in 2017
- Basic Statistic U.S. favorite cartoons among adults 2018, by ethnicity
Television and film
8
- Premium Statistic Connected TV and SVOD households in the U.S. 2019, by ethnicity
- Premium Statistic U.S. TV consumption: average viewing time 2009-2022, by ethnicity
- Premium Statistic Largest Hispanic TV markets in the U.S. 2017
- Premium Statistic Top Spanish-language TV programs in the U.S. 2016
- Premium Statistic U.S. frequent moviegoers 2017-2019, by ethnicity
- Premium Statistic Frequency of going to the movies in the U.S. 2022, by ethnicity
- Premium Statistic Preferred place of movie consumption in the U.S. 2018, by ethnicity
- Premium Statistic Share of adults who have a Netflix subscription in the U.S. 2021, by ethnicity
News
6
- Premium Statistic News sources among Hispanics in the U.S. in 2017
- Basic Statistic Share of ethnic minorities on TV news in the U.S. by gender 2018
- Basic Statistic TV newsroom employees in the U.S. 2017-2022, by ethnicity
- Premium Statistic Public opinion on news media in the U.S. 2017, by ethnicity
- Premium Statistic Trust in news sources among Hispanics in the U.S. in 2017
- Premium Statistic Perceived frequency of media reporting fake news U.S. 2017, by ethnicity
Radio
6
- Premium Statistic Spanish-language radio news station revenue in the U.S. 2009-2018
- Premium Statistic Number of radio listeners in the U.S. 2013-2018, by ethnicity
- Premium Statistic Hispanic weekly radio listeners in the U.S. 2018
- Premium Statistic Radio reach among Hispanics in the U.S. 2021, by age and gender
- Premium Statistic Time Hispanics spend listening to the radio 2018, by age and gender
- Premium Statistic Hispanic radio listening in the U.S. 2018, by location
Books
8
- Premium Statistic Average reading time in the U.S. 2018-2022, by ethnicity
- Premium Statistic Average number of books read yearly by U.S. consumers in April 2017, by ethnicity
- Premium Statistic U.S. consumers types of reading material in April 2017, by ethnicity
- Premium Statistic Genres regularly read by U.S. consumers in April 2017, by ethnicity
- Premium Statistic Reasons for reading by U.S. consumers in April 2017, by ethnicity
- Premium Statistic Occasions for reading among U.S. consumers in April 2017, by ethnicity
- Premium Statistic Preference for print books or e-books by U.S. consumers April 2017, by ethnicity
- Premium Statistic Number of individual e-books U.S. consumers purchased April 2017, by ethnicity
Music
5
- Premium Statistic Hispanics: leading music services in the U.S. 2017
- Premium Statistic Latin music listener distribution in the U.S. 2018, by gender
- Premium Statistic Popularity of Latin music in the U.S. 2018, by ethnicity
- Basic Statistic Music genres which represent classic Americana in the U.S. 2018, by ethnicity
- Basic Statistic Music genres which represent modern America in the U.S. 2018, by ethnicity
Further related statistics
17
- Gender profile of free audio streaming service users in Great Britain 2013-2016
- Age profile of audio streaming service users in Great Britain (UK) 2016
- Survey on drivers when choosing music service among Facebook users in Finland 2017
- Distribution of time spent listening to audio across Australia 2019 by platform
- Audio streams served in the United Kingdom (UK) 2012-2016
- Share of U.S. iPhone users accessing digital music sources 2015
- Survey on drivers when choosing music service among YouTube users in Finland 2017
- Most used digital music services in Denmark 2022
- Leading music services in Norway 2017, by user type
- Leading music services in Sweden 2017, by user type
- Time spent listening to Spotify and Apple Music daily in Australia 2017 by age group
- Music audio content consumption on mobile phones worldwide 2017, by country
- Penetration of music streaming in the United Kingdom (UK) 2016-2017, by service type
- Survey on digital music versions in Denmark 2017, by age
- Most commonly used service of music contents South Korea 2018
- Reach of audio streaming services in the U.S. 2017, by age
- Forecast: revenue sound recording and music publishing Germany 2008-2020
Further Content: You might find this interesting as well
Statistics
- Gender profile of free audio streaming service users in Great Britain 2013-2016
- Age profile of audio streaming service users in Great Britain (UK) 2016
- Survey on drivers when choosing music service among Facebook users in Finland 2017
- Distribution of time spent listening to audio across Australia 2019 by platform
- Audio streams served in the United Kingdom (UK) 2012-2016
- Share of U.S. iPhone users accessing digital music sources 2015
- Survey on drivers when choosing music service among YouTube users in Finland 2017
- Most used digital music services in Denmark 2022
- Leading music services in Norway 2017, by user type
- Leading music services in Sweden 2017, by user type
- Time spent listening to Spotify and Apple Music daily in Australia 2017 by age group
- Music audio content consumption on mobile phones worldwide 2017, by country
- Penetration of music streaming in the United Kingdom (UK) 2016-2017, by service type
- Survey on digital music versions in Denmark 2017, by age
- Most commonly used service of music contents South Korea 2018
- Reach of audio streaming services in the U.S. 2017, by age
- Forecast: revenue sound recording and music publishing Germany 2008-2020
Nielsen. (July 11, 2018). Share of consumers who use audio streaming services in the United States in 1st quarter of 2018, by ethnicity [Graph]. In Statista. Retrieved May 29, 2024, from https://www.statista.com/statistics/897686/audio-streaming-service-users-united-states-by-ethnicity/
Nielsen. "Share of consumers who use audio streaming services in the United States in 1st quarter of 2018, by ethnicity." Chart. July 11, 2018. Statista. Accessed May 29, 2024. https://www.statista.com/statistics/897686/audio-streaming-service-users-united-states-by-ethnicity/
Nielsen. (2018). Share of consumers who use audio streaming services in the United States in 1st quarter of 2018, by ethnicity. Statista. Statista Inc.. Accessed: May 29, 2024. https://www.statista.com/statistics/897686/audio-streaming-service-users-united-states-by-ethnicity/
Nielsen. "Share of Consumers Who Use Audio Streaming Services in The United States in 1st Quarter of 2018, by Ethnicity." Statista, Statista Inc., 11 Jul 2018, https://www.statista.com/statistics/897686/audio-streaming-service-users-united-states-by-ethnicity/
Nielsen, Share of consumers who use audio streaming services in the United States in 1st quarter of 2018, by ethnicity Statista, https://www.statista.com/statistics/897686/audio-streaming-service-users-united-states-by-ethnicity/ (last visited May 29, 2024)
Share of consumers who use audio streaming services in the United States in 1st quarter of 2018, by ethnicity [Graph], Nielsen, July 11, 2018. [Online]. Available: https://www.statista.com/statistics/897686/audio-streaming-service-users-united-states-by-ethnicity/