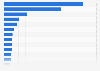
Nota: La página que ha solicitado no está en su idioma predeterminado. Usted está usando nuestra plataforma en otro idioma ahora.
The statistic illustrates the share of inappropriate posts on the Polish internet from 2011 to 2016, broken down by service type. In 2016 the lowest percentage of improper posts was observed on blogs (less than one percent). On social media sites, the percentage of inappropriate posts increased slightly to two percent, while a distinct increase was noted on forum posts and in article comments (from around one percent in 2011 to almost five percent in 2016).
Share of inappropriate posts on the Polish internet from 2011 to 2016, by service type
Basic Account
Get to know the platform
You only have access to basic statistics.
This statistic is not included in your account.
Starter Account
The ideal entry-level account for individual users
- Instant access to 1m statistics
- Download in XLS, PDF & PNG format
- Detailed references
$199 USD / Month *
Professional Account
Full access
Business Solutions including all features.
* Prices do not include sales tax.
Other statistics that may interest you Statistics on
About the industry
9
- Premium Statistic Frequency of experiencing offline and online peer violence among teens in Poland 2018
- Premium Statistic Frequency of exposure to online hate speech by teenagers in Poland 2018
- Premium Statistic Reasons why young people receive hate speech online in Poland 2018
- Premium Statistic Outcomes for organizations after ransom payments worldwide 2023
- Premium Statistic Total damage due to fraud in banking in the Netherlands 2016-2020
- Basic Statistic Share of children being bullied on social media in Denmark 2018, by age and gender
- Basic Statistic Share of children being bullied on social media in Denmark 2018, by social class
- Premium Statistic Total damage due to payment fraud in the Netherlands 2012-2018
- Premium Statistic Cyber threats share in Russia 2020, by country of origin
About the region
10
- Premium Statistic Opinion regarding online anonymity in Poland 2011-2016
- Basic Statistic Hours spent on YouTube by young internet users in Poland 2017
- Premium Statistic Pupils' hopes related to internet development in Poland 2018
- Premium Statistic Threats and unsafe behavior as a result of internet use by children in Poland 2022
- Premium Statistic Social media site activities of people with FOMO in Poland 2022
- Premium Statistic FOMO scale in Poland 2022
- Premium Statistic Engagement in social media in Poland 2022
- Premium Statistic Internet activities of pupils in Poland 2022
- Premium Statistic Devices used by pupils for internet access in Poland 2018-2022
- Premium Statistic Websites used by students to prepare for exams and tests in Poland 2018-2022
Selected statistics
1
Other regions
10
- Basic Statistic Leading new Google search terms worldwide YTD 2020
- Basic Statistic Most popular goods purchased online by Gen Z in Great Britain 2020
- Premium Statistic Key figures of Sina Weibo microblog leading user activities in China 2018
- Premium Statistic Average daily media use time in the United Kingdom (UK) 2023
- Basic Statistic Internet usage for searching information about health in Finland 2023, by age group
- Premium Statistic Most watched YouTube video genres in Russia 2022
- Premium Statistic Daily social media usage in Sweden 2010-2020
- Premium Statistic Puerto Rico: change in mobile data consumption due to COVID-19, by provider
- Premium Statistic Social networks and advertising: knowledge of young French students 2019
- Basic Statistic Social media users in Denmark 2017-2018, by social media site
Related statistics
10
- Premium Statistic Most frequently visited websites by women with children aged 8-14 in Poland 2019
- Basic Statistic Most frequently visited websites by women with children aged 15-18 in Poland 2019
- Premium Statistic Most frequently visited websites by men with children aged 0-7 years in Poland 2019
- Basic Statistic Most frequently visited websites by men with children aged 8-14 in Poland 2019
- Basic Statistic Most frequently visited websites by men with children aged 15-18 in Poland 2019
- Premium Statistic Average internet map and locator page view duration in Poland 2019, by age group
- Premium Statistic Usage reach of leading social networks in Poland 2017, by frequency
- Basic Statistic Number of Instagram users in Poland 2017, by device
- Basic Statistic Number of Twitter users in Poland 2017, by device
- Premium Statistic Number of LinkedIn users in Poland 2017, by professional status
Further related statistics
10
- Mobile internet use via laptops in Great Britain 2019, by demographic
- Internet usage on a mobile phone in Great Britain 2010-2019, by age
- Households with internet access in GB from 2014 to 2020, by household composition
- Social network profile creation in the UK 2010-2020, by socio-economic group
- Daily internet use penetration in Great Britain 2006-2020
- Hours of internet use per week in the United Kingdom (UK) 2005-2019, by location
- User numbers of microblogs in China 2010-2018
- Use of smartphones by shoppers in retail stores in Italy in 2015
- Breakdown of U.S. online ad revenue 2023, by format
- Online advertising revenue in the U.S. 2012-2023, by half-year
Further Content: You might find this interesting as well
Statistics
- Mobile internet use via laptops in Great Britain 2019, by demographic
- Internet usage on a mobile phone in Great Britain 2010-2019, by age
- Households with internet access in GB from 2014 to 2020, by household composition
- Social network profile creation in the UK 2010-2020, by socio-economic group
- Daily internet use penetration in Great Britain 2006-2020
- Hours of internet use per week in the United Kingdom (UK) 2005-2019, by location
- User numbers of microblogs in China 2010-2018
- Use of smartphones by shoppers in retail stores in Italy in 2015
- Breakdown of U.S. online ad revenue 2023, by format
- Online advertising revenue in the U.S. 2012-2023, by half-year
IAB Polska. (May 10, 2017). Share of inappropriate posts on the Polish internet from 2011 to 2016, by service type [Graph]. In Statista. Retrieved May 11, 2024, from https://www.statista.com/statistics/987605/poland-inappropriate-internet-posts/
IAB Polska. "Share of inappropriate posts on the Polish internet from 2011 to 2016, by service type." Chart. May 10, 2017. Statista. Accessed May 11, 2024. https://www.statista.com/statistics/987605/poland-inappropriate-internet-posts/
IAB Polska. (2017). Share of inappropriate posts on the Polish internet from 2011 to 2016, by service type. Statista. Statista Inc.. Accessed: May 11, 2024. https://www.statista.com/statistics/987605/poland-inappropriate-internet-posts/
IAB Polska. "Share of Inappropriate Posts on The Polish Internet from 2011 to 2016, by Service Type." Statista, Statista Inc., 10 May 2017, https://www.statista.com/statistics/987605/poland-inappropriate-internet-posts/
IAB Polska, Share of inappropriate posts on the Polish internet from 2011 to 2016, by service type Statista, https://www.statista.com/statistics/987605/poland-inappropriate-internet-posts/ (last visited May 11, 2024)
Share of inappropriate posts on the Polish internet from 2011 to 2016, by service type [Graph], IAB Polska, May 10, 2017. [Online]. Available: https://www.statista.com/statistics/987605/poland-inappropriate-internet-posts/