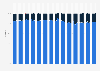
Nota: La página que ha solicitado no está en su idioma predeterminado. Usted está usando nuestra plataforma en otro idioma ahora.
This statistic presents the consumer perspective on the growing influence that online technology's impact has on individual's lives. According to the May 2018 findings, 1.4 percent of respondents in the United States reported that they found the growing influence of online technology to have made their lives significantly worse off, while in comparison 43 percent of respondents stated otherwise; stating that they found it has made their lives significantly better.
How has the growing influence of online technology impacted your life?
Basic Account
Get to know the platform
You only have access to basic statistics.
Starter Account
The ideal entry-level account for individual users
- Instant access to 1m statistics
- Download in XLS, PDF & PNG format
- Detailed references
$199 USD / Month *
Professional Account
Full access
Business Solutions including all features.
* Prices do not include sales tax.
Other statistics that may interest you Statistics on
About the industry
10
- Basic Statistic Average hourly unlocks among U.S. smartphone users 2018
- Basic Statistic Length of unlock sessions among U.S. smartphone users 2018
- Basic Statistic Length of first app use within an unlock session among U.S. smartphone users 2018
- Premium Statistic Distribution of push notifications among U.S. smartphone users 2018
- Basic Statistic Percentage of time spent from first app visit among U.S. smartphone users 2018
- Basic Statistic Unlock engagement ratio of leading mobile apps in the U.S. 2018
- Premium Statistic Americans: share who compared prices on their smartphone in the last 30 days in 2022
- Premium Statistic Americans who read news pages on their smartphone 2022, by income
- Basic Statistic Parallel usage of internet and television in Germany 2014-2022
- Premium Statistic Daily time spent on mobile phones in the U.S. 2019-2024
About the region
10
- Premium Statistic Top business practices to improve talent availability 2023, by region
- Premium Statistic Global cobalt reserves 2023, by country
- Basic Statistic Global cobalt reserves 2010-2023
- Premium Statistic Law firms' share of billing through e-billing worldwide 2021
- Premium Statistic Largest portfolio management/reporting tools used by advisory firms worldwide 2023
- Premium Statistic Retail investors' preference for technology and people worldwide 2021, by country
- Premium Statistic Preference of humans vs. robo-advisors for retail investment advice worldwide 2021
- Premium Statistic Share of insurtech transactions in selected countries worldwide Q3 2021
- Premium Statistic Share of insurtech transactions in selected countries worldwide 2012-2021
- Premium Statistic Distribution of insurtech transactions globally 2012-2021, by investment stage
Other regions
10
- Premium Statistic Opinion of parents on the effect of phone on their child in the United States 2019
- Basic Statistic Access to virtual health care visits in Canada in 2018 and 2019
- Basic Statistic Daily usage of smartphone in Italy in 2019
- Premium Statistic Most funded Chinese smart device startups 2020
- Premium Statistic Malaysia - types of mobile operator/carrier used for personal phones 2018
- Premium Statistic Serbia: electronic device usage 2017
- Premium Statistic Colombia - mobile phone features used 2018
- Premium Statistic Central America: smartphone share of mobile phone users by country 2017
- Premium Statistic United Arab Emirates - types of mobile phone plans owned 2017-2018
- Premium Statistic Saudi Arabia - types of mobile operator/carrier used for personal phones 2018
Related statistics
10
- Premium Statistic France home internet usage 2011-2022, by device and type of connection
- Basic Statistic Share of French people leaving their mobile phone on at night 2019
- Basic Statistic Share of elderly who use their smartphone for selected purposes in Norway 2018
- Basic Statistic Problems with smartphones among elderly in Norway 2018
- Basic Statistic Internet devices used by farmers to manage their activity in France 2019
- Basic Statistic Share of farmers using technology or connected devices in France 2019, by type
- Basic Statistic Share of U.S. location-based service users 2015, by ethnicity
- Premium Statistic France: mobile app usage to make voice calls 2014-2022
- Premium Statistic Annual growth of key digital indicators in Sweden 2022
- Premium Statistic U.S. health data breaches caused by hacking 2014-2022
Further related statistics
10
- Leading trends in technology in restaurants in the U.S. 2015*
- Survey: ownership of mobile devices by U.S. American adults 2011-2012
- Device usage among children to consume media in the United Kingdom (UK) 2013-2019
- Internet usage on a mobile phone in Great Britain 2010-2019, by age
- Apple iPhone sales worldwide 2007-2022
- Device preference for internet browsing in the United Kingdom (UK) 2015, by age
- Use of smartphones by shoppers in retail stores in Italy in 2015
- Use of mobile devices to make restaurant reservations in the U.S. 2014, by age group
- Smartphone share of handset unit sales in the United Kingdom (UK) 2010-2013
- U.S. cell phone owners who use mobile banking 2013, by ethnicity
Further Content: You might find this interesting as well
Statistics
- Leading trends in technology in restaurants in the U.S. 2015*
- Survey: ownership of mobile devices by U.S. American adults 2011-2012
- Device usage among children to consume media in the United Kingdom (UK) 2013-2019
- Internet usage on a mobile phone in Great Britain 2010-2019, by age
- Apple iPhone sales worldwide 2007-2022
- Device preference for internet browsing in the United Kingdom (UK) 2015, by age
- Use of smartphones by shoppers in retail stores in Italy in 2015
- Use of mobile devices to make restaurant reservations in the U.S. 2014, by age group
- Smartphone share of handset unit sales in the United Kingdom (UK) 2010-2013
- U.S. cell phone owners who use mobile banking 2013, by ethnicity
Limelight Networks. (June 25, 2018). How has the growing influence of online technology impacted your life? [Graph]. In Statista. Retrieved May 11, 2024, from https://www.statista.com/statistics/946778/growing-influence-online-technology-impact-peoples-lives-worldwide/
Limelight Networks. "How has the growing influence of online technology impacted your life?." Chart. June 25, 2018. Statista. Accessed May 11, 2024. https://www.statista.com/statistics/946778/growing-influence-online-technology-impact-peoples-lives-worldwide/
Limelight Networks. (2018). How has the growing influence of online technology impacted your life?. Statista. Statista Inc.. Accessed: May 11, 2024. https://www.statista.com/statistics/946778/growing-influence-online-technology-impact-peoples-lives-worldwide/
Limelight Networks. "How Has The Growing Influence of Online Technology Impacted Your Life?." Statista, Statista Inc., 25 Jun 2018, https://www.statista.com/statistics/946778/growing-influence-online-technology-impact-peoples-lives-worldwide/
Limelight Networks, How has the growing influence of online technology impacted your life? Statista, https://www.statista.com/statistics/946778/growing-influence-online-technology-impact-peoples-lives-worldwide/ (last visited May 11, 2024)
How has the growing influence of online technology impacted your life? [Graph], Limelight Networks, June 25, 2018. [Online]. Available: https://www.statista.com/statistics/946778/growing-influence-online-technology-impact-peoples-lives-worldwide/