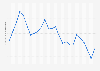
Nota: La página que ha solicitado no está en su idioma predeterminado. Usted está usando nuestra plataforma en otro idioma ahora.
Equinor's crude oil and natural gas sales volume amounted to 702 million barrels of oil equivalent in 2022, down from 719 million barrels of oil equivalent in the previous year. Since 2013, crude oil and natural gas sales volume of Equinor across the globe have experienced an overall increasing trend.
Crude oil and natural gas sales volume of Equinor worldwide from 2013 to 2022 (in million barrels of oil equivalent)
Basic Account
Get to know the platform
You only have access to basic statistics.
This statistic is not included in your account.
Starter Account
The ideal entry-level account for individual users
- Instant access to 1m statistics
- Download in XLS, PDF & PNG format
- Detailed references
$199 USD / Month *
Professional Account
Full access
Business Solutions including all features.
* Prices do not include sales tax.
Other statistics that may interest you Statistics on
About the industry
10
- Premium Statistic Global number of productive oil and gas wells of Equinor 2021
- Premium Statistic Equinor's net profit 2013-2023
- Premium Statistic Global exploration expenses of Equinor 2014-2022
- Premium Statistic Global revenue of Equinor 2023, by segment
- Premium Statistic Equinor's revenue by product 2023
- Premium Statistic Equinor's revenue 2013-2023
- Premium Statistic Equinor's employment figures 2013-2023
- Premium Statistic Global employee number of Equinor by geographic area 2013-2022
- Premium Statistic Equinor's Marketing, Midstream & Processing segment revenue 2016-2023
- Premium Statistic Global revenue of Equinor by country 2021
About the region
10
- Premium Statistic Equinor's gas sales volume 2014-2023
- Basic Statistic Leading crude petroleum and natural gas companies in the Nordics 2022, by turnover
- Premium Statistic Leading crude petroleum and natural gas companies in Norway 2022, by turnover
- Premium Statistic Leading crude petroleum and natural gas companies in the Nordics 2020, by employees
- Premium Statistic Leading crude petroleum and natural gas companies in Norway 2020, by employees
- Premium Statistic Global revenue of Equinor by country and product 2021
- Basic Statistic Global developed and undeveloped acreage held by Equinor 2021
- Basic Statistic Equinor's Exploration & Production Norway segment revenue 2016-2023
- Premium Statistic Global number of productive gas wells of Equinor by geographic area 2021
- Premium Statistic Operating revenue of Aibel 2012-2016
Selected statistics
10
- Premium Statistic U.S. oil and gas industry annual revenue 2010-2022
- Basic Statistic Nabors Industries' net income 2002-2020
- Basic Statistic Nabors Industries' total assets 2002-2020
- Basic Statistic Cameron International's number of employees 2008-2015
- Premium Statistic Schlumberger Limited's revenue 2008-2023
- Premium Statistic U.S. oil and gas industry CAPEX 2010-2022
- Basic Statistic Devon Energy's total assets 2007-2020
- Basic Statistic Murphy Oil: net income 2007-2020
- Basic Statistic Eni S.p.A.'s oil spills from operations 2009-2019
- Basic Statistic BASF's revenue in the Oil & Gas segment 2007-2017
Other regions
10
- Premium Statistic Employee number of Statoil Refining Denmark 2012-2016
- Premium Statistic Exploration & Production International segment revenue of Equinor 2016-2022
- Premium Statistic Natural gas production in Russia 2021, by company
- Premium Statistic Anadarko Petroleum's fossil fuels sales volumes 2007-2018
- Premium Statistic Italy: number of oil and gas wells in 2017, by managing company
- Premium Statistic Imperial Oil's oil and gas reserves by type 2022
- Premium Statistic Funding for offshore oil and gas companies by leading French banks 2016-2019
- Basic Statistic North American natural gas production cost by gas producing region 2015
- Premium Statistic Pemex's proven hydrocarbon reserves 2003-2023
- Premium Statistic BP's quarterly net loss 2020
Related statistics
10
- Premium Statistic Equinor's liquids sales volume 2013-2023
- Premium Statistic Global number of productive oil wells of Equinor by geographic area 2021
- Premium Statistic Equinor's brand value 2015-2023
- Basic Statistic Diamond Offshore Drilling's fleet size 2010-2024
- Basic Statistic Drilled but uncompleted oil and gas wells in the U.S. 2021-2023, by region
- Premium Statistic McDermott's net income 2009-2019
- Basic Statistic McDermott's revenue 2009-2019
- Premium Statistic McDermott's number of employees 2010-2019
- Premium Statistic Chevron's brand value 2024
- Premium Statistic Leading oil and gas companies' brand value worldwide 2024
Further related statistics
10
- Apache Corporation's net income 2007-2020
- APA Corporation's revenue 2007-2023
- Devon Energy revenue 2007-2023
- Noble Energy's natural gas sales volumes 2009-2019
- EOG Resources' total assets 2009-2020
- Devon Energy's earnings 2007-2020
- Oil consumption in Japan 1990-2022
- Global natural gas production 2022, by country
- Eni S.p.A.'s refinery throughputs 2009-2019
- Concho Resources' revenue 2007-2019
Further Content: You might find this interesting as well
Statistics
- Apache Corporation's net income 2007-2020
- APA Corporation's revenue 2007-2023
- Devon Energy revenue 2007-2023
- Noble Energy's natural gas sales volumes 2009-2019
- EOG Resources' total assets 2009-2020
- Devon Energy's earnings 2007-2020
- Oil consumption in Japan 1990-2022
- Global natural gas production 2022, by country
- Eni S.p.A.'s refinery throughputs 2009-2019
- Concho Resources' revenue 2007-2019
Equinor. (March 23, 2023). Crude oil and natural gas sales volume of Equinor worldwide from 2013 to 2022 (in million barrels of oil equivalent) [Graph]. In Statista. Retrieved May 02, 2024, from https://www.statista.com/statistics/827026/crude-oil-and-natural-gas-sales-volume-of-statoil/
Equinor. "Crude oil and natural gas sales volume of Equinor worldwide from 2013 to 2022 (in million barrels of oil equivalent)." Chart. March 23, 2023. Statista. Accessed May 02, 2024. https://www.statista.com/statistics/827026/crude-oil-and-natural-gas-sales-volume-of-statoil/
Equinor. (2023). Crude oil and natural gas sales volume of Equinor worldwide from 2013 to 2022 (in million barrels of oil equivalent). Statista. Statista Inc.. Accessed: May 02, 2024. https://www.statista.com/statistics/827026/crude-oil-and-natural-gas-sales-volume-of-statoil/
Equinor. "Crude Oil and Natural Gas Sales Volume of Equinor Worldwide from 2013 to 2022 (in Million Barrels of Oil Equivalent)." Statista, Statista Inc., 23 Mar 2023, https://www.statista.com/statistics/827026/crude-oil-and-natural-gas-sales-volume-of-statoil/
Equinor, Crude oil and natural gas sales volume of Equinor worldwide from 2013 to 2022 (in million barrels of oil equivalent) Statista, https://www.statista.com/statistics/827026/crude-oil-and-natural-gas-sales-volume-of-statoil/ (last visited May 02, 2024)
Crude oil and natural gas sales volume of Equinor worldwide from 2013 to 2022 (in million barrels of oil equivalent) [Graph], Equinor, March 23, 2023. [Online]. Available: https://www.statista.com/statistics/827026/crude-oil-and-natural-gas-sales-volume-of-statoil/