Nota: La página que ha solicitado no está en su idioma predeterminado. Usted está usando nuestra plataforma en otro idioma ahora.

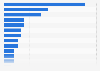
Time spent watching TV in the U.S. 2017, by device

Share of weekly time spent watching TV among consumers in the United States in 2017, by device

Download
Show detailed source information?
Register for free
Already a member?
Log in
Sources

Use Ask Statista Research Service

Release date

May 2017

Region

United States

Survey time period

March 2017

Number of respondents

753 respondents

Age group

18 years and older

Special properties

among respondents who own any type of TV

Method of interview

Online panel

Supplementary notes

This question was phrased by the source as follows: "Think of all your video content viewing on a TV screen, including both smart TV and regular TV sets. In a typical week, what’s the percentage of your time spent watching each of the following? "

Citation formats
Statista Accounts: Access All Statistics. Starting from $2,388 USD / Year
Basic Account
Get to know the platform

You only have access to basic statistics.
This statistic is not included in your account.

Starter Account
The ideal entry-level account for individual users
  • Instant access to 1m statistics
  • Download in XLS, PDF & PNG format
  • Detailed references
$199 USD / Month *
Professional Account
Full access

Business Solutions including all features.

* Prices do not include sales tax.

Other statistics that may interest you

Other statistics that may interest you Statistics on

About the industry

9

About the region

10

Selected statistics

5

Other regions

10

Related statistics

10

Further related statistics

3
Statista Accounts: Access All Statistics. Starting from $2,388 USD / Year
Learn more about how Statista can support your business.