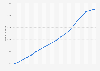
Business and government spending tech goods and services Philippines 2013-2018
The statistic depicts the forecasted business and government spending on tech goods and services in the the Philippines from 2013 to 2015 and a forecast from 2016 to 2018. For 2018, the forecasted business and government spending on tech goods and services in the the Philippines is approximately seven billion U.S. dollars.