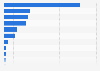
Nota: La página que ha solicitado no está en su idioma predeterminado. Usted está usando nuestra plataforma en otro idioma ahora.
The export worth of the two largest automotive goods' categories exported from Russia have gradually increased during the period under consideration. Thus, exports of Russian light cars & LCV and auto parts amounted to 1.6 and 1.7 billion U.S. dollars in 2019, therefore marking 24 and 6 percent growth rates year-on-year, respectively.
Automotive products export value in Russia from 2015 to 2019, by category (in billion U.S. dollars)
Basic Account
Get to know the platform
You only have access to basic statistics.
This statistic is not included in your account.
Starter Account
The ideal entry-level account for individual users
- Instant access to 1m statistics
- Download in XLS, PDF & PNG format
- Detailed references
$199 USD / Month *
Professional Account
Full access
Business Solutions including all features.
* Prices do not include sales tax.
Other statistics that may interest you Statistics on
About the industry
10
- Premium Statistic Vehicle fleet by type in Guatemala 2020
- Premium Statistic Brazil: automotive exports to Mexico 2010-2022
- Premium Statistic Brazil: automotive exports to the U.S. 2010-2022
- Premium Statistic Brazil: automotive imports from the U.S. 2010-2022
- Premium Statistic Brazil: exports of the automotive industry 2013-2022, by segment
- Premium Statistic Brazil: automotive imports from the European Union 2010-2022
- Premium Statistic Brazil: automotive exports to the European Union 2010-2022
- Premium Statistic Brazil: leading destinations for automotive exports 2022, by value
- Premium Statistic Brazil: leading origins for automotive imports 2022, by value
- Premium Statistic Domestic sales of the automobile industry in Germany 2013-2023
About the region
10
- Premium Statistic Automotive exports share in Russia 2015-2019, by category
- Basic Statistic Most sold Lada models during COVID-19 outbreak in Russia 2020
- Premium Statistic Annual number of sold trucks in Russia 2010-2022
- Basic Statistic Used passenger cars' market distribution in Russia 2019, by brand
- Premium Statistic Domestic road transport of goods worldwide 2017
- Premium Statistic Russia: production of heavy trucks from 2014 to 2022
- Premium Statistic Number of new passenger cars sold in Russia 2012-2027
- Premium Statistic Annual new commercial vehicle sales in Russia 2005-2022
- Premium Statistic Offline advertising spending share in Russia 2022, by industry
- Basic Statistic Public survey on the frequentness of electric cars in Russia in 2021
Selected statistics
2
Other regions
10
- Premium Statistic Export value of automotive products Thailand 2013-2023
- Premium Statistic Online automotive aftermarket and parts retail by key market 2022
- Premium Statistic Leading heavy vehicle brands by unit sales in Peru 2021
- Premium Statistic Share of automotive parts imports by Ford in Vietnam 2018, by country
- Premium Statistic Motor vehicle fleet size in Mexico 2009-2020
- Premium Statistic Heavy commercial vehicle sales in Argentina 2017-2021
- Premium Statistic U.S.: personal expenditures on vehicle parts & accessories 2010-2022
- Premium Statistic Heavy truck production volume APAC 2021 by country or region
- Premium Statistic Auto parts export value South Korea 2013-2022
- Premium Statistic Foreign sales of the automobile industry in Germany 2013-2023
Related statistics
10
- Basic Statistic Public survey on willingness to buy an electric car in Russia in 2022
- Basic Statistic Public survey on disadvantages of electric cars in Russia in 2022
- Premium Statistic Road freight volume in Russia 2022, by federal district
- Premium Statistic Passenger cars and LCVs sales volume in Russia 2023, by brand
- Premium Statistic Russia: volume of truck sales in Russia 2012-2022
- Premium Statistic Car production volume in Russia 2020, by type and origin
- Basic Statistic Public survey on advantages of electric cars in Russia in 2020
- Premium Statistic Automotive goods e-stores marketing service usage in Russia 2019, by type
- Premium Statistic Automotive goods e-stores newsletter service usage in Russia 2019, by type
- Premium Statistic Automotive goods e-stores volume on Yandex.Market in Russia 2010-2019
Further Content: You might find this interesting as well
EY. (March 30, 2020). Automotive products export value in Russia from 2015 to 2019, by category (in billion U.S. dollars) [Graph]. In Statista. Retrieved May 09, 2024, from https://www.statista.com/statistics/1136283/russia-automotive-product-exports-by-category/
EY. "Automotive products export value in Russia from 2015 to 2019, by category (in billion U.S. dollars) ." Chart. March 30, 2020. Statista. Accessed May 09, 2024. https://www.statista.com/statistics/1136283/russia-automotive-product-exports-by-category/
EY. (2020). Automotive products export value in Russia from 2015 to 2019, by category (in billion U.S. dollars) . Statista. Statista Inc.. Accessed: May 09, 2024. https://www.statista.com/statistics/1136283/russia-automotive-product-exports-by-category/
EY. "Automotive Products Export Value in Russia from 2015 to 2019, by Category (in Billion U.S. Dollars) ." Statista, Statista Inc., 30 Mar 2020, https://www.statista.com/statistics/1136283/russia-automotive-product-exports-by-category/
EY, Automotive products export value in Russia from 2015 to 2019, by category (in billion U.S. dollars) Statista, https://www.statista.com/statistics/1136283/russia-automotive-product-exports-by-category/ (last visited May 09, 2024)
Automotive products export value in Russia from 2015 to 2019, by category (in billion U.S. dollars) [Graph], EY, March 30, 2020. [Online]. Available: https://www.statista.com/statistics/1136283/russia-automotive-product-exports-by-category/