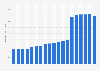
Nota: La página que ha solicitado no está en su idioma predeterminado. Usted está usando nuestra plataforma en otro idioma ahora.
The average amount spent by Disneyland Paris visitors has increased between 2010 and 2016. In 2016, a visitor spent an average of 54 euros per day on the entrance ticket, catering and additional expenses on site.
Average amount spent per day by visitors to Euro Disney theme parks in France from 2010 to 2016 (in euros excluding VAT)
Loading statistic...
Basic Account
Get to know the platform
You only have access to basic statistics.
Starter Account
The ideal entry-level account for individual users
- Instant access to 1m statistics
- Download in XLS, PDF & PNG format
- Detailed references
$199 USD / Month *
Professional Account
Full access
Business Solutions including all features.
* Prices do not include sales tax.
Other statistics that may interest you Statistics on
About the industry
10
- Premium Statistic Recreational and cultural services: household expenditure in Hungary 2011-2022
- Premium Statistic Expenditure of Swedish households on recreation and cultural service 2010-2021
- Premium Statistic Expenditure of Danish households on recreation and cultural services 2010-2022
- Basic Statistic Recreational and cultural services household expenditure in Greece 2008-2021
- Premium Statistic Recreational and cultural services household expenditure in Austria 2008-2021
- Premium Statistic Recreational and cultural services: household expenditure in Poland 2010-2020
- Premium Statistic Brazilians' budget for summer plans 2022
- Premium Statistic Recreational and cultural services: household expenditure in Ireland 2008-2019
- Premium Statistic Recreational and cultural services: household expenditure in Portugal 2008-2019
- Basic Statistic Recreational and cultural services: household expenditure in the EU 2008-2016
About the region
10
- Premium Statistic Average price of fresh poultry in France 2021, by type of meat
- Premium Statistic Average price of charcuterie in France 2021, by type of meat
- Premium Statistic Sales value of charcuterie products in France 2021, by type of meat
- Basic Statistic Consumer expenditure on glassware, tableware and utensils in France 2011-2022
- Basic Statistic Consumer spending on footwear in France 2011-2022
- Basic Statistic Consumer expenditure on household appliances in France 2011-2022
- Premium Statistic Average price fresh butcher's meat in France 2021, by type of meat
- Premium Statistic Sales value of fresh butcher's meat in France 2021, by kind of meat
- Basic Statistic Household spending on agrifood products in France 2016-2020
- Basic Statistic Consumer spending on clothing in France 2008-2020
Other regions
10
- Premium Statistic Consumer confidence indicator in Belgium in 2018-2023, by region
- Basic Statistic Clothing and footwear expenditure per capita in Europe 2015, by country
- Premium Statistic Household consumption expenditure on personal care in Iceland 2010-2021
- Basic Statistic Average weekly household expenditure in Scotland 2021, by category
- Basic Statistic Annual household expenditure on bread in Canada 2010-2021
- Basic Statistic Consumer expenditure on glassware, tableware and utensils in Luxembourg 2008-2020
- Premium Statistic Monthly FMCG spending Vietnam 2017-2021, by degree of urbanization
- Premium Statistic New Year's holiday spending in Russia 2019-2021
- Basic Statistic Consumer spending on footwear in Latvia 2008-2019
- Premium Statistic Expenditure on catering services in Romania 2013-2022
Related statistics
10
- Premium Statistic Share of UK household spend on cinema, theater, and museums 2020-2022, by income
- Premium Statistic Share of UK household spend on domestic package holidays 2020 and 2022, by income
- Premium Statistic Share of UK household spend on TV and video equipment 2020 and 2022, by income group
- Premium Statistic UK household spend on recreational and cultural services 2020 and 2022, by income
- Premium Statistic Package holidays household expenditure in Germany 2008-2021
- Premium Statistic Package holidays: household expenditure in the Netherlands 2008-2019
- Basic Statistic Spending on recreational and cultural services in the UK 2005-2022
- Premium Statistic Cultural services expenditure trend in the United Kingdom (UK) 2005-2020
- Basic Statistic Recreational and cultural services quarterly spending (by volume) in the UK 2015-2020
- Premium Statistic Package holidays: household expenditure in Italy 2008-2018
Further related statistics
9
- Universal Orlando Islands of Adventure theme park attendance 2009-2022
- Most visited Latin American amusement and theme parks 2019-2022
- Seaworld Florida theme park attendance 2009-2022
- Seaworld California theme park attendance 2009-2022
- Busch Gardens Tampa Bay theme park attendance 2009-2022
- Walt Disney World Magic Kingdom theme park attendance 2009-2022
- Disneyland theme park (California) attendance 2009-2022
- Most visited amusement and theme parks in North America 2022
- Change in attendance at amusement and theme parks in Europe 2019-2022
Further Content: You might find this interesting as well
Statistics
- Universal Orlando Islands of Adventure theme park attendance 2009-2022
- Most visited Latin American amusement and theme parks 2019-2022
- Seaworld Florida theme park attendance 2009-2022
- Seaworld California theme park attendance 2009-2022
- Busch Gardens Tampa Bay theme park attendance 2009-2022
- Walt Disney World Magic Kingdom theme park attendance 2009-2022
- Disneyland theme park (California) attendance 2009-2022
- Most visited amusement and theme parks in North America 2022
- Change in attendance at amusement and theme parks in Europe 2019-2022
Euro Disney. (December 1, 2016). Average amount spent per day by visitors to Euro Disney theme parks in France from 2010 to 2016 (in euros excluding VAT) [Graph]. In Statista. Retrieved May 11, 2024, from https://www.statista.com/statistics/1116728/spendings-tourists-disneyland-paris-france/
Euro Disney. "Average amount spent per day by visitors to Euro Disney theme parks in France from 2010 to 2016 (in euros excluding VAT)." Chart. December 1, 2016. Statista. Accessed May 11, 2024. https://www.statista.com/statistics/1116728/spendings-tourists-disneyland-paris-france/
Euro Disney. (2016). Average amount spent per day by visitors to Euro Disney theme parks in France from 2010 to 2016 (in euros excluding VAT). Statista. Statista Inc.. Accessed: May 11, 2024. https://www.statista.com/statistics/1116728/spendings-tourists-disneyland-paris-france/
Euro Disney. "Average Amount Spent per Day by Visitors to Euro Disney Theme Parks in France from 2010 to 2016 (in Euros excluding Vat)." Statista, Statista Inc., 1 Dec 2016, https://www.statista.com/statistics/1116728/spendings-tourists-disneyland-paris-france/
Euro Disney, Average amount spent per day by visitors to Euro Disney theme parks in France from 2010 to 2016 (in euros excluding VAT) Statista, https://www.statista.com/statistics/1116728/spendings-tourists-disneyland-paris-france/ (last visited May 11, 2024)
Average amount spent per day by visitors to Euro Disney theme parks in France from 2010 to 2016 (in euros excluding VAT) [Graph], Euro Disney, December 1, 2016. [Online]. Available: https://www.statista.com/statistics/1116728/spendings-tourists-disneyland-paris-france/