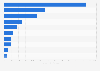
Nota: La página que ha solicitado no está en su idioma predeterminado. Usted está usando nuestra plataforma en otro idioma ahora.
According to a household survey carried out in Mexico, quarterly expenditure on glassware, linen, and home utensils in the country amounted to over eight billion Mexican pesos in 2022. Two years prior, Mexican consumers spent roughly six billion Mexican pesos on glassware, linen, and home utensils.
Quarterly expenditure on glassware, linen, and home utensils in Mexico from 2016 to 2022 (in billion Mexican pesos)
Basic Account
Get to know the platform
You only have access to basic statistics.
This statistic is not included in your account.
Starter Account
The ideal entry-level account for individual users
- Instant access to 1m statistics
- Download in XLS, PDF & PNG format
- Detailed references
$199 USD / Month *
Professional Account
Full access
Business Solutions including all features.
* Prices do not include sales tax.
Other statistics that may interest you Statistics on
About the industry
10
- Premium Statistic Mexico: expenditure on home appliances 2016-2022
- Premium Statistic United States: spending on occasional tables 2018-2020
- Premium Statistic Rate at which U.S. consumers changed their mattresses as of 2018, by age
- Premium Statistic U.S. consumers' favorite type of mattress foundation as of 2018
- Premium Statistic U.S. consumers' favorite type of mattress material as of 2018
- Premium Statistic Global and U.S. housewares expenditure in 2016
- Premium Statistic Rate at which U.S. consumers changed their mattresses in 2007 and 2016
- Premium Statistic Most important mattress purchase drivers to U.S. consumers as of 2016
- Premium Statistic U.S. consumers' price expectation of a quality mattress in 2007 and 2016
- Premium Statistic U.S. consumers' willingness to pay for queen-size mattresses as of 2016, by age
About the region
10
- Premium Statistic Mexico: expenditure on cleaning products and services 2016-2022
- Premium Statistic Mexico: private expenditure on health care 2016-2018
- Premium Statistic Mexico: expenditure on footwear 2016-2020
- Premium Statistic Mexico: expenditure on clothing and footwear 2016-2022
- Premium Statistic Mexico: expenditure on personal care 2016-2022
- Premium Statistic Mexico: expenditure on children's clothing 2016-2022
- Premium Statistic Mexico: expenditure on adult's clothing 2016-2022
- Premium Statistic Mexico: expenditure on clothing 2016-2022
- Premium Statistic Mexico: quarterly expenditure on alcoholic beverages 2016-2022
- Premium Statistic Mexico: expenditure on plant-based proteins 2016-2022
Selected statistics
1
Other regions
10
- Premium Statistic Average amount of e-money spent on public transport Japan 2023
- Basic Statistic Russians' leisure spending plans during COVID-19 2020, by category
- Premium Statistic Brazil: distribution of households led by women 2017, by age
- Premium Statistic Average weekly spend on groceries by organic and non-organic shoppers in Canada 2016
- Premium Statistic Share of consumer spending on housing and utilities in ASEAN 2015, by country
- Premium Statistic Consumer expenditure on food per week in the United States 2022
- Basic Statistic Colombia: most popular Father's Day gifts in 2023
- Basic Statistic Share of households buying organic products in the Netherlands 2018-2019
- Basic Statistic People engaged in panic buying due to COVID-19 India 2020 by gender
- Premium Statistic Share of people engaged in panic buying due to COVID-19 in Malaysia 2020
Related statistics
10
- Premium Statistic Millennials willing to pay for premium products in LatAm 2017, by category
- Premium Statistic Generation X willing to pay for premium products in LatAm 2017, by category
- Premium Statistic Import value of men's intimate fashion articles Spain 2022
- Premium Statistic Brazil: average price per piece of clothing 2023-2028, by category
- Basic Statistic Consumer consumption of glassware, tableware and utensils in Spain 2013-2022
- Basic Statistic Consumer spending for household textiles in Spain 2012-2022
- Basic Statistic Spain: wholesale trade sales value 2021, by sub-sector
- Premium Statistic Brazil: purchase frequency of clothing and accessories 2020
- Premium Statistic Brazil: apparel consumption by socioeconomic level 2019
- Premium Statistic Mexico: shopping frequency of luxury beauty products 2020, by gender
Further related statistics
9
- Per capita consumer spending in India 1974-2012
- Life insurance coverage sentiment in the U.S. 2016, by age
- Loyalty program ownership in U.S. restaurants as of November 2013, by restaurant type
- Resources shoppers use most often to make purchase decisions in the UK 2013
- Consumers willingness to share personal data with retailers in the UK in 2013, by age
- Where consumers shop for clothing and footwear in the United Kingdom (UK) 2013
- Channels consumers use for their main grocery shop in the United Kingdom (UK) 2013
- Coffee shops, tea shops and cafes: where consumers go in the United Kingdom (UK) 2013
- Hairdressing and beauty: Where consumers access services in the United Kingdom 2013
Further Content: You might find this interesting as well
Statistics
- Per capita consumer spending in India 1974-2012
- Life insurance coverage sentiment in the U.S. 2016, by age
- Loyalty program ownership in U.S. restaurants as of November 2013, by restaurant type
- Resources shoppers use most often to make purchase decisions in the UK 2013
- Consumers willingness to share personal data with retailers in the UK in 2013, by age
- Where consumers shop for clothing and footwear in the United Kingdom (UK) 2013
- Channels consumers use for their main grocery shop in the United Kingdom (UK) 2013
- Coffee shops, tea shops and cafes: where consumers go in the United Kingdom (UK) 2013
- Hairdressing and beauty: Where consumers access services in the United Kingdom 2013
INEGI. (July 26, 2023). Quarterly expenditure on glassware, linen, and home utensils in Mexico from 2016 to 2022 (in billion Mexican pesos) [Graph]. In Statista. Retrieved May 19, 2024, from https://www.statista.com/statistics/1049738/glassware-linen-and-home-utensils-quarterly-expenditure-mexico/
INEGI. "Quarterly expenditure on glassware, linen, and home utensils in Mexico from 2016 to 2022 (in billion Mexican pesos)." Chart. July 26, 2023. Statista. Accessed May 19, 2024. https://www.statista.com/statistics/1049738/glassware-linen-and-home-utensils-quarterly-expenditure-mexico/
INEGI. (2023). Quarterly expenditure on glassware, linen, and home utensils in Mexico from 2016 to 2022 (in billion Mexican pesos). Statista. Statista Inc.. Accessed: May 19, 2024. https://www.statista.com/statistics/1049738/glassware-linen-and-home-utensils-quarterly-expenditure-mexico/
INEGI. "Quarterly Expenditure on Glassware, Linen, and Home Utensils in Mexico from 2016 to 2022 (in Billion Mexican Pesos)." Statista, Statista Inc., 26 Jul 2023, https://www.statista.com/statistics/1049738/glassware-linen-and-home-utensils-quarterly-expenditure-mexico/
INEGI, Quarterly expenditure on glassware, linen, and home utensils in Mexico from 2016 to 2022 (in billion Mexican pesos) Statista, https://www.statista.com/statistics/1049738/glassware-linen-and-home-utensils-quarterly-expenditure-mexico/ (last visited May 19, 2024)
Quarterly expenditure on glassware, linen, and home utensils in Mexico from 2016 to 2022 (in billion Mexican pesos) [Graph], INEGI, July 26, 2023. [Online]. Available: https://www.statista.com/statistics/1049738/glassware-linen-and-home-utensils-quarterly-expenditure-mexico/