Nota: La página que ha solicitado no está en su idioma predeterminado. Usted está usando nuestra plataforma en otro idioma ahora.

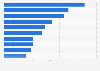
Boehringer Ingelheim's distribution of revenue by business 2016-2022

Distribution of Boehringer Ingelheim's revenue from 2016 to 2022, by business area

Download
Show detailed source information?
Register for free
Already a member?
Log in
Source

Use Ask Statista Research Service

Release date

March 2023

Region

Worldwide

Survey time period

2016 to 2022

Supplementary notes

Missing percentage points to 100 percent in some years are due to discontinued operations. The statistic was assembled from several annual reports.

Citation formats
Statista Accounts: Access All Statistics. Starting from $2,388 USD / Year
Basic Account
Get to know the platform

You only have access to basic statistics.
This statistic is not included in your account.

Starter Account
The ideal entry-level account for individual users
  • Instant access to 1m statistics
  • Download in XLS, PDF & PNG format
  • Detailed references
$199 USD / Month *
Professional Account
Full access

Business Solutions including all features.

* Prices do not include sales tax.

Statistics on " Novo Nordisk "

Other statistics that may interest you Novo Nordisk

Global positioning

6

Key metrics

4

Segments

4

Competitors

5

Diabetes - a growing market

6

Further related statistics

19
Statista Accounts: Access All Statistics. Starting from $2,388 USD / Year
Learn more about how Statista can support your business.