Nota: La página que ha solicitado no está en su idioma predeterminado. Usted está usando nuestra plataforma en otro idioma ahora.

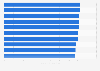
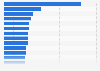
U.S. suburban areas - crime clearance rate 2020, by type

Crime clearance rate in suburban areas in the United States in 2020, by type

Loading statistic...
Download
Show detailed source information?
Register for free
Already a member?
Log in
Sources

Use Ask Statista Research Service

Release date

September 2021

Region

United States

Survey time period

2020

Supplementary notes

Figures shown for rape only include those reported by law enforcement agencies using the revised Uniform Crime Reporting definition of rape.

Not all agencies submit reports for arson to the FBI. As a result, the number of reports the FBI uses to compute the percent of offenses cleared for arson is less than the number it uses to compute the percent of offenses cleared for all other offenses.

Suburban areas include law enforcement agencies in cities with less than 50,000 inhabitants and county law enforcement agencies that are within a Metropolitan Statistical Area. Suburban areas exclude all metropolitan agencies associated with a principal city.

Citation formats
Statista Accounts: Access All Statistics. Starting from $2,388 USD / Year
Basic Account
Get to know the platform

You only have access to basic statistics.

Starter Account
The ideal entry-level account for individual users
  • Instant access to 1m statistics
  • Download in XLS, PDF & PNG format
  • Detailed references
$199 USD / Month *
Professional Account
Full access

Business Solutions including all features.

* Prices do not include sales tax.

Other statistics that may interest you

The most important statistics

Other statistics that may interest you Statistics on

About the industry

10

About the region

10

Selected statistics

1

Other regions

10

Related statistics

10

Further related statistics

2
Statista Accounts: Access All Statistics. Starting from $2,388 USD / Year
Learn more about how Statista can support your business.