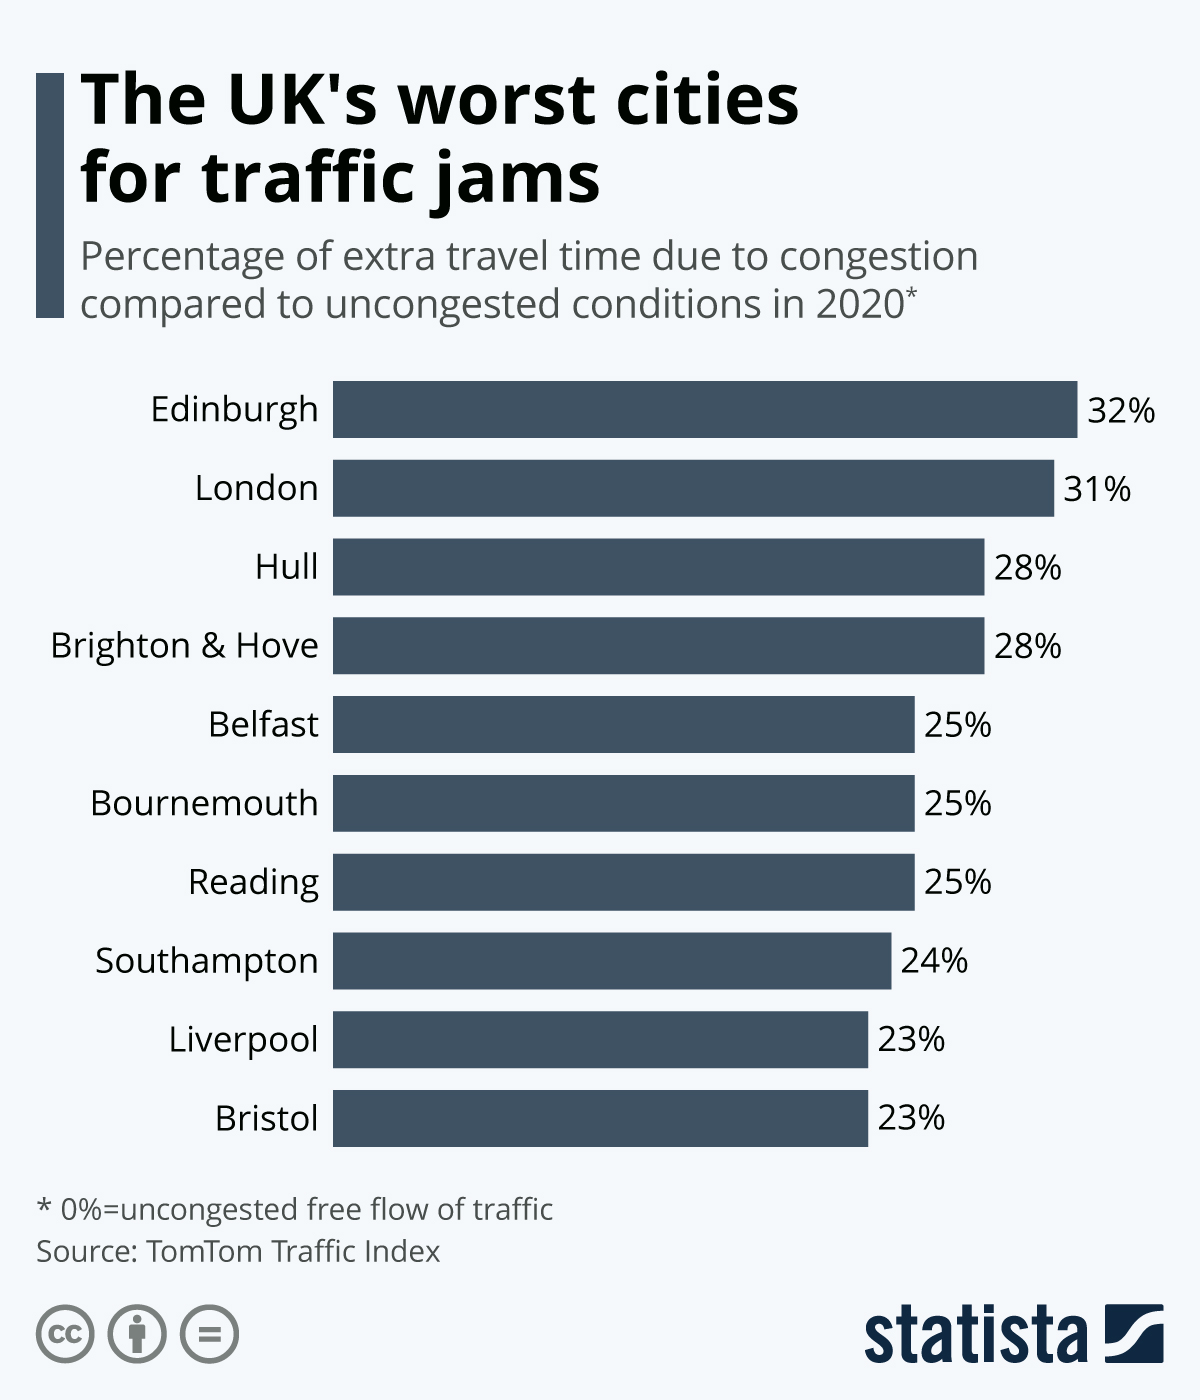
Data from TomTom has revealed the huge amount of time commuters in the UK's most congested cities spend stuck in traffic each year. As this chart shows, the Scottish capital has been named the worst city in the UK for this. When compared to normal conditions, the average commuter in the city needs 32 percent longer to get to their destination during 'rush hour'. London isn't too much better, with 31 percent longer and the top-three is rounded off by Hull at 28 percent. The figures are considerably lower than 2019 due to the effects on traffic volumes caused by Covid-19 lockdown measures. Last year, Edinburgh was at the top of the ranking, but with 41 percent.
The UK's worst cities for traffic jams
Commuting

Description
This chart shows the UK cities with the highest percentage of extra travel time due to congestion compared to uncongested conditions in 2020.


